

If you have a SaaS platform that has a considerable amount of users, you might have hit this question multiple times already.
%252525252018.21.34.png)
In the product lifecycle, there is a time where the way that things have been built starts to impact performance for new use case scenarios.
Your product has been architected and thought to fulfill a given set of requirements, but requirements change later down the road, and the system adapts to deliver the new requirements. This iteration loop repeats itself over and over once a product has overcome the MVP stage and is reaching a certain maturity level with a considerable user base.
The architectural decisions that had been made when conceiving the product, along with the development practices established, compromises the way future features are implemented. As the product starts to grow over iterations, new features are implemented following the existing architecture and practices, but those might not be a good fit for the implemented features. Then, users adopt these features and the user base grows.
A typical case for this is having chosen to use a non-relational database because you had a lot of unstructured data to model, to later find out the system ends up requiring complex queries and joins between collections.
As traffic grows, the system might suffer from a performance 'death by a thousand cuts'. This means, the performance of your system drops but there is not a specific cause (rather multiple) to explain why. In a serverless environment you end up paying a bunch of money but the performance drop is solved by scaling the system up. On the other hand, in a single server environment your users suffer from your system's performance drop, which usually means slow page navigations, infinite loading spinners and so on.
Observability
Observability refers to the ability to monitor and understand the internal state of a system by examining its metrics. It goes beyond traditional monitoring by focusing not only on the system's output but also on its performance and behavior over time. This is key to diagnose and resolve performance issues.
Enabling observability in your systems allows for better monitoring and troubleshooting.
It can be implemented all across the tech stack, this means any component of the platform could be measured, from back end services to front end applications, including super specific metrics like query and request times for back end services or time to first byte for front end apps. Some of these tools are Datadog or New Relic, both paid, or Grafana + Prometheus if you want an Open Source alternative. Complemented with Google Analytics, for understanding user behavior, these are really powerful tools.
How using Datadog saved our customer thousands of dollars in Cloud Services
Real world scenario; one of customers that we've built a payment system for vending machines for, is hitting a peak in usage after winning a huge supermarket chain in South America to use the payment system as part of the benefits program for their employees.
In a very short period of time they added >2000 users to the system from a Monday to Saturday. One of the first symptoms we saw from the system not properly handling this load, is users complaining about how slow payments were at lunch time, the rush hour.
We did some testing with minor tweaks on the code to see if we could find the reason on why the system was going so slow, but the improvements were really small. None of our theories was true.

At our Denver office, we have this neon sign that summarizes why you need observability. We had our opinions about what was going on but we didn't have data to back those opinions up.
The hot-fix solution was to simply get a bigger VPS to handle the new load, but the AWS bill skyrocketed to 3x the previous amount, so in order to understand what was going on we installed Datadog across the stack. We wanted to monitor traces, Host metrics (CPU, Memory, IO), Web Server metrics (latency, reqs/sec), and Database metrics (queries/sec, query latency, concurrency).
The first thing we discovered was a scheduled job blowing up performance every 30 minutes, removing it solved a lot of the issues.
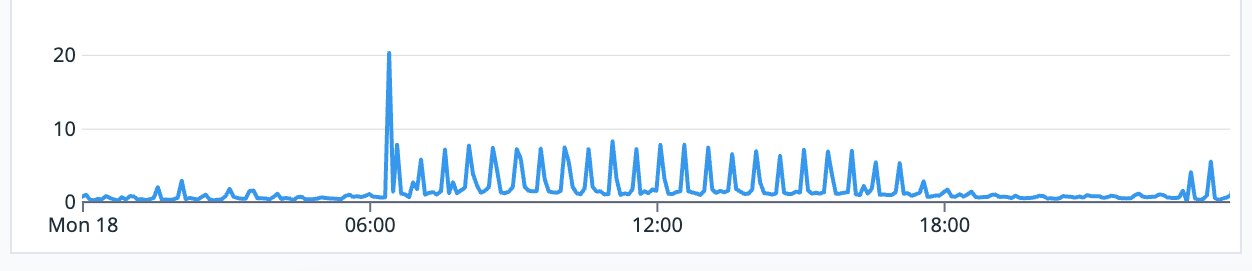
[Datadog] latency in seconds, peaks are generated by a process locking the db each 30 mins
Later, more detailed research was done to find the top queries that had the most latency during the rush hour. To improve the performance of those queries in both the database and the server code, we looked for and found bottlenecks, mostly in the database.
%252525252019.10.29.png)
[Datadog] most hit queries
After a few deploys to production, we could go back to the old server hardware to handle the new traffic load and lower payment back to the baseline.
Today, as part of our ongoing maintenance work of this system, we're keeping an eye on the server's metrics , using Datadog's alerts and monitors, to let us know when latency goes out of bounds so we can track which code change caused it, or if there's growth in traffic.
What Nimble Gravity can do for you
We love metrics at Nimble Gravity, and have helped dozens of customers to take data based decisions. In addition to creating products and helping customers to transform their vision into an MVP and launch it to market, we want to join customer's journey during the product life cycle.
We provide Tech Strategy services, software and product development, and ongoing maintenance services, which includes setup of observability tools like Datadog and research on how to solve performance issues on Websites and Mobile apps.
If you think we can help you, feel free to Contact Us here